Chapter 06 · Handbook
Good Map vs Bad Map
Two layouts of the same size, side by side — one nets +1,999 a year, the other bleeds −4,374. The whole difference is how the line is arranged.
These are two layouts of roughly the same 40-worker size, built on the same board and judged in the same year (1980, with the full cost staircase in force). The difference in outcome is enormous, and it comes entirely from how the line is arranged.
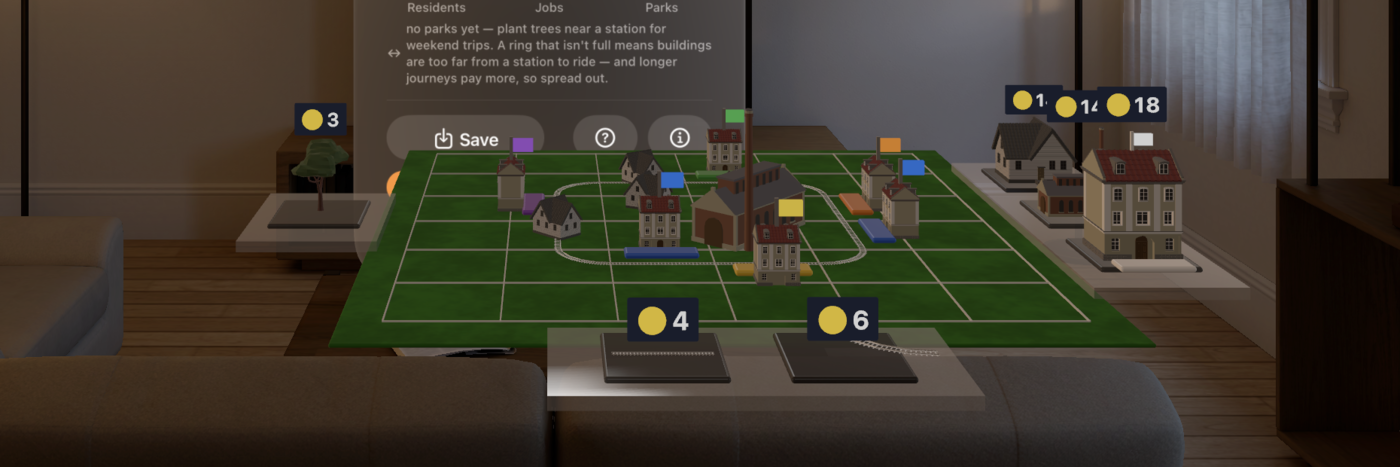
The good line
 A compact, well-built layout: one oval, four spaced stations, dense clustered blocks
A compact oval with four well-spaced, distinct-colour stations. Homes (tall Apartment Blocks) cluster tight to one stop; jobs and a park cluster at the far end — directly across the loop — so the shortest way between them is as long as the ring allows, for top fares. Few pieces, all of them pulling their weight.
A compact, well-built layout: one oval, four spaced stations, dense clustered blocks
A compact oval with four well-spaced, distinct-colour stations. Homes (tall Apartment Blocks) cluster tight to one stop; jobs and a park cluster at the far end — directly across the loop — so the shortest way between them is as long as the ring allows, for top fares. Few pieces, all of them pulling their weight.
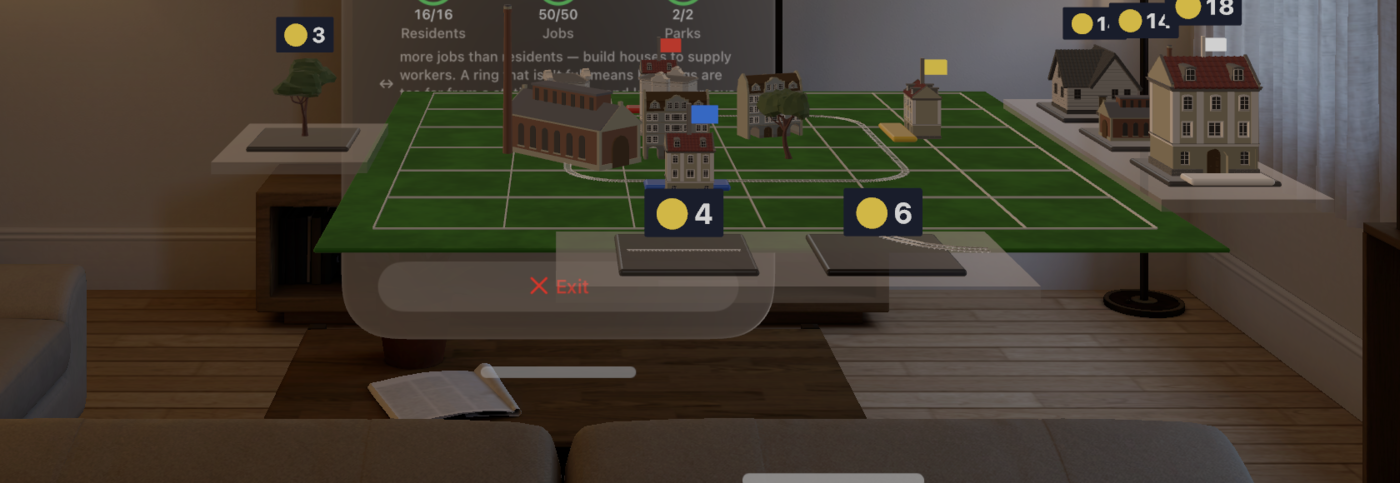
The bad line
 A sprawled layout: a station on nearly every straight, buildings scattered into the interior
The same starting city, sprawled across a bigger board with a station marker on nearly every straight (colours recycle, the train dwells at each), low-density houses scattered thin, and several buildings stranded deep in the interior — more than two cells from any platform, so they earn nothing while still billing upkeep.
A sprawled layout: a station on nearly every straight, buildings scattered into the interior
The same starting city, sprawled across a bigger board with a station marker on nearly every straight (colours recycle, the train dwells at each), low-density houses scattered thin, and several buildings stranded deep in the interior — more than two cells from any platform, so they earn nothing while still billing upkeep.
What the board sees
| Good line | Bad line | |
|---|---|---|
| Board | 14×14 | 20×20 (over-expanded) |
| Stations | 6 | 24 |
| Buildings | 8 (dense, balanced) | 26 (sparse, scattered) |
| Train seats | 17 (scaled) | 5 (starter) |
| Income | 3,616 | 750 |
| Cost | 1,617 | 5,124 |
| Margin / period | +1,999 | −4,374 |
| Operating ratio | 0.45 (meets target) | 6.83 (catastrophic miss) |
Both lines judged in 1980, with the full cost staircase in force.
Why the bad line loses on every axis
- Over-stationed: 24 platforms at 0.9/period each, on the 1.15-power curve, is the bulk of that 5,124 cost — and the train dwells at every one.
- Over-expanded: the 20×20 board cost a fortune in quadratic land, and its long trips are wasted against the 26-cell fare cap.
- Sparse & scattered: low-density houses spread thin, several stranded outside every catchment — full upkeep, zero fares.
- Under-powered train: a 5-seat starter can't collect even the demand it does generate.
The good line is the mirror image: compact, dense, balanced, a handful of stations, one scaled train. Same city, +1,999 a year instead of −4,374. Multiply that gap across a century and it's the difference between Railway King and bankruptcy.
The playbook that produces the good line is in The Optimal Playbook. But first, the shocks that test it — The Long Century & the Strike.